Your business data lives across three systems and a unified view needs someone exporting spreadsheets every morning. We build the pipeline that pulls it together: ETL between systems, a reporting database or warehouse, and dashboards your management team actually uses. Built clean enough that AI features can sit on top later.
A well-modelled data layer is the prerequisite for reliable AI. We design pipelines so a vector store or a retrieval endpoint can sit on top without a nightly export, which is why several teams come to us after an AI pilot stalls on messy data.
Fixed-price, scoped after we have seen your source systems. Get your number →
If one of these is your reality, here is what we do about it.
Every board pack starts with someone exporting and merging spreadsheets for a day.
We automate the pipeline behind it. Sources pulled, cleaned, and modelled on a schedule, so the numbers are ready when the meeting is, not the night before.
Two systems disagree on the same number and nobody knows which to trust.
One modelled source of truth. A transformation layer that reconciles the sources with defined rules, and validation that flags when they drift apart.
Your dashboard tool is connected straight to the production database and slows the app down.
We separate analytics from operations. A reporting database or warehouse that analytics run against, so a heavy query never competes with a customer.
Your AI pilot stalled because the data feeding it is inconsistent and scattered.
We build the clean layer it needs. Consistent, modelled data with a retrieval endpoint the AI can query directly, no nightly export.
From getting data out of stubborn source systems to a dashboard a director opens on a Monday.
Getting data out of your CRM, ERP, accounting, and operational systems reliably: via API, database replica, scheduled export, or webhook. Built with retries, monitoring, and alerting so a failed run is visible, not silent.
The right store for your scale: a well-modelled Postgres reporting database for many businesses, BigQuery or Snowflake where volume and source count justify it. We recommend the smallest thing that works and explain the tradeoffs.
Turning raw source tables into a clean, documented model that reflects how your business actually works, with the reconciliation rules that resolve disagreements between systems. This is the layer that makes reports trustworthy.
Profiling to find the duplicates and gaps, cleaning and deduplication built into the pipeline, and checks that flag anomalies before they reach a dashboard. Plus one-off historical cleanups scoped with a clear before and after.
Real-time dashboards with filters and drill-downs, and the scheduled reports your management team relies on, in the formats they actually need. Built on the modelled layer so the numbers are consistent everywhere they appear.
Where AI is on the roadmap, we add a retrieval endpoint and, if needed, a vector store fed by the same pipeline, so RAG features and agents query current, consistent data rather than a stale copy.
They overrun when the difficulty of the source systems is discovered mid-build. We assess every source before we scope.
We look at every source: does it have a real API, a database we can replica, an export we can schedule? How fresh does the data need to be? We tell you which sources are straightforward and which need a workaround, so the effort is priced up front.
We design the reporting model around your real metrics and definitions, including the reconciliation rules for where systems disagree. Getting this right is what makes every downstream report trustworthy.
Extraction, validation, deduplication, transformation, and load, with monitoring and anomaly alerts as part of the pipeline, not something added later. We profile the source data early to surface the mess before it reaches production.
We phase the work so the highest-value reports land well before the full platform is done. You start getting value while later sources are still being connected.
Before anyone relies on the new numbers, we reconcile them against the spreadsheets and reports the business trusts today, and explain any differences. Trust in the data is earned, not assumed.
Every metric traceable back to its source, pipeline code and models documented, infrastructure configuration handed over. Your team or another vendor can maintain and extend it. A 30-day support window is standard.
We match the platform to your data volume and source count. The smallest thing that works is usually right.
Fixed-price, scoped after we have seen your sources, because the source systems are where the cost lives.
Two or three sources into a modelled reporting database, with quality checks and a first set of dashboards. 8–14 weeks.
Many sources, a warehouse, a transformation layer, and self-serve analytics for the wider team. Delivered in phases. 16–28 weeks.
Everything in the platform tier plus a retrieval layer and vector store fed by the same pipeline, so AI features query current data.
If the goal is AI features on top of this data, see AI Development. If it is agents that act on it, see AI Agent Development.
30 minutes. Tell us your source systems. We will tell you what a real pipeline takes.
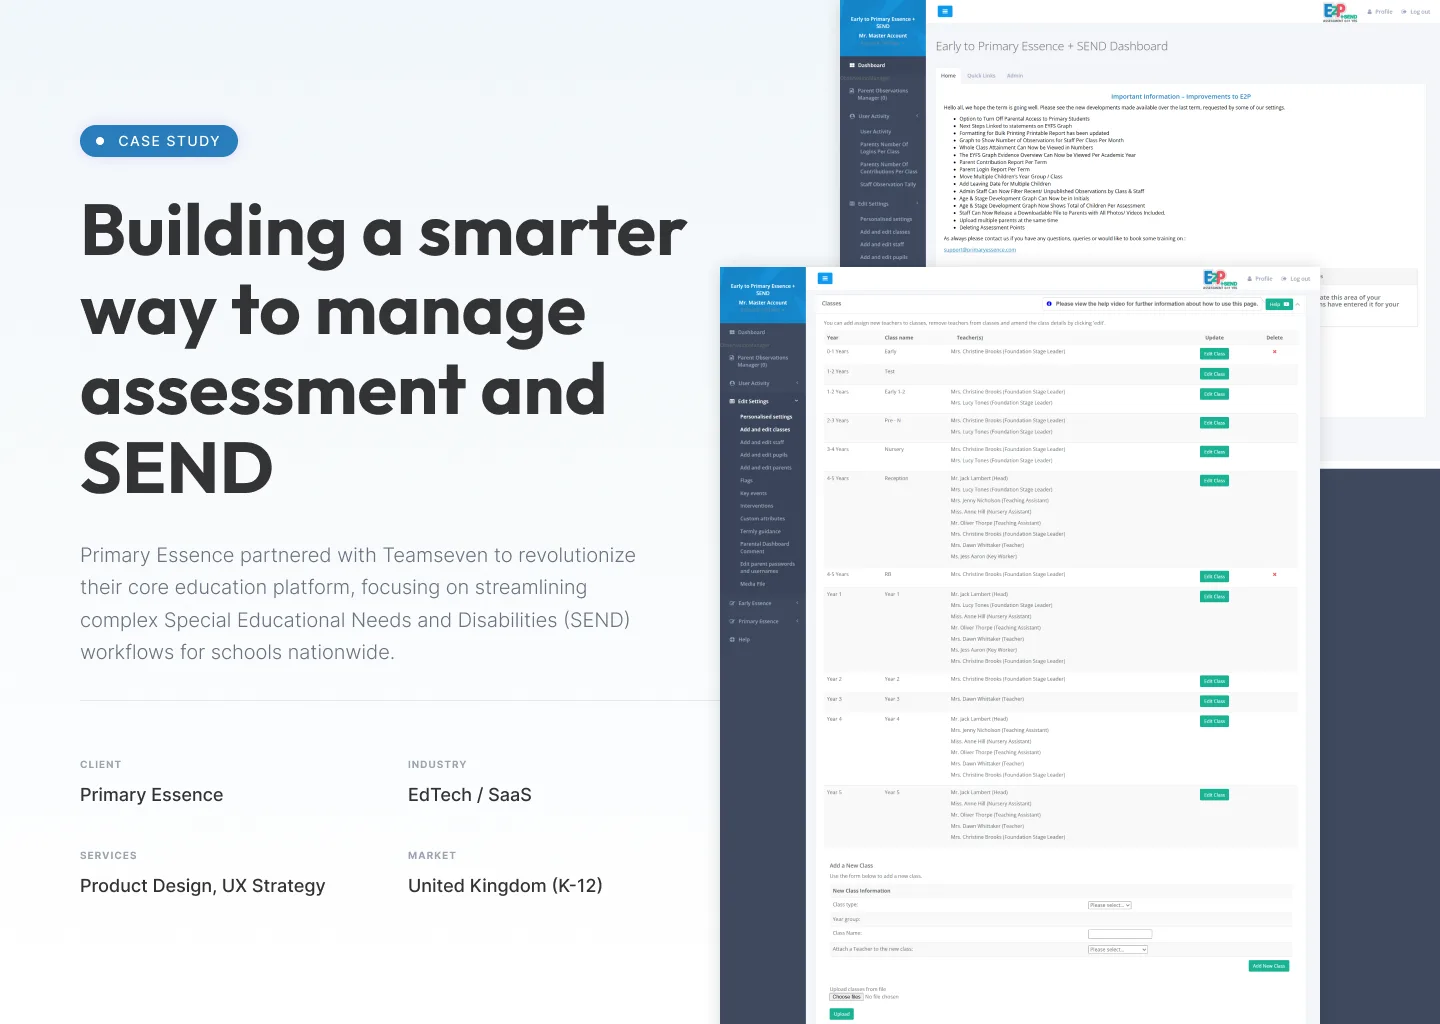
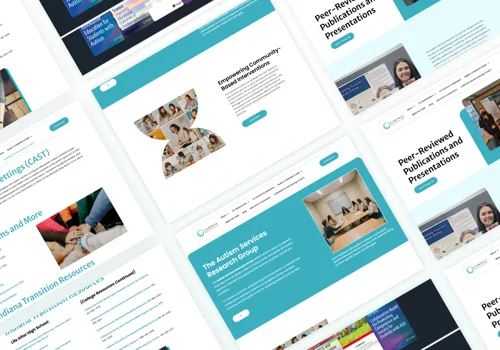
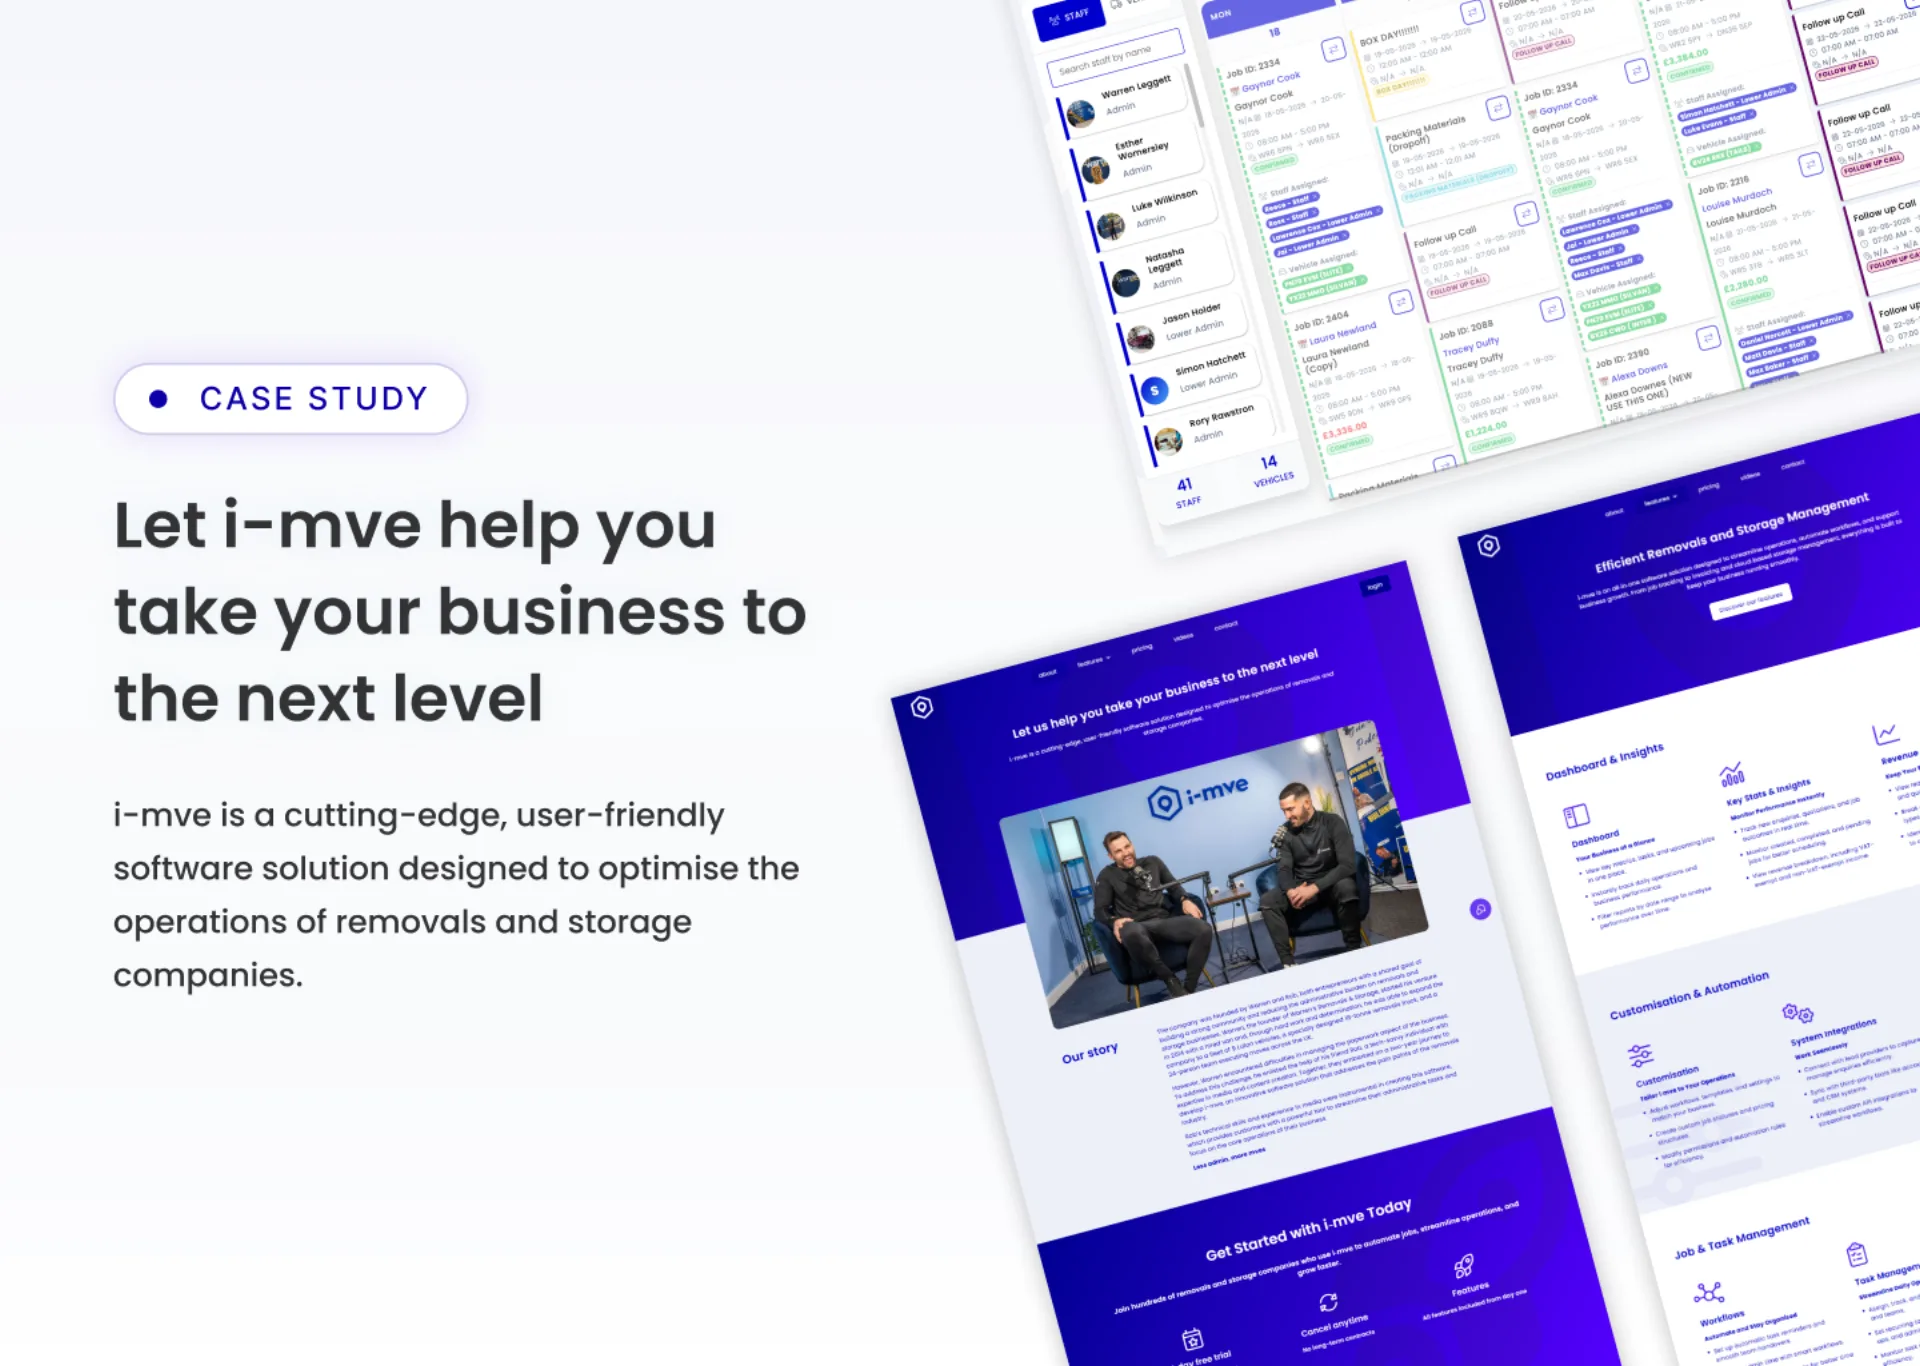
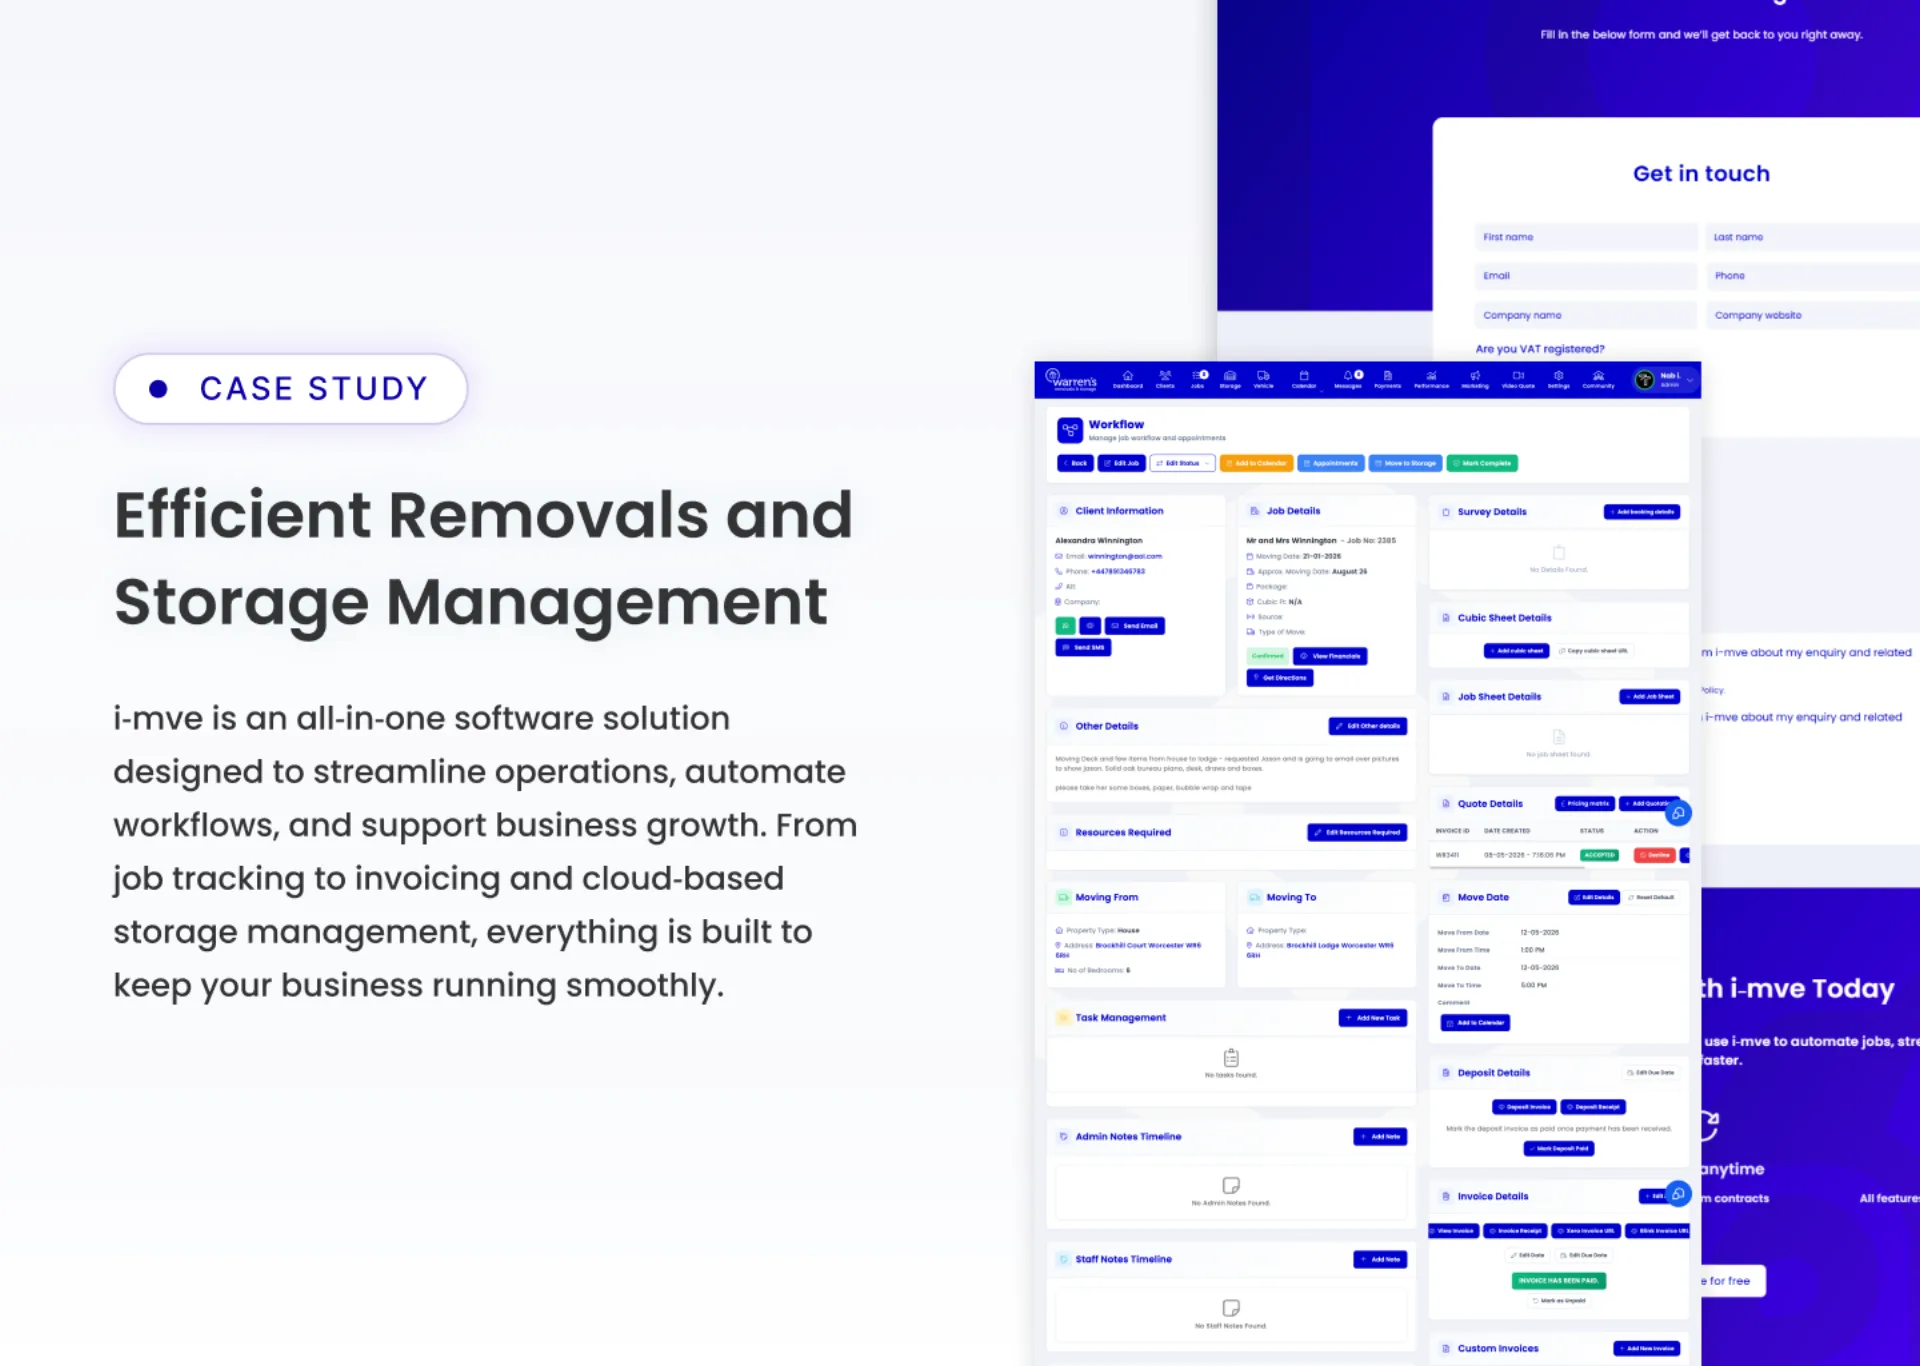
The reporting infrastructure in COMPASS for Ball State University collects data under clinical research standards and transforms it into a structure researchers can query and report against. i-mve consolidates job, quoting, invoicing, and accounting data across integrations into one operational view for 510 companies. We have built ETL between systems, reporting databases, and real-time dashboards across logistics, healthcare research, and property since 2017. You own every pipeline, model, and dashboard definition we build.
Straight answers on warehouses, source systems, data quality, AI, cost, and ownership.
Data engineering is building the pipelines and storage that get data from your source systems into one place, clean and queryable. Analytics is what you do with it once it is there: dashboards, reports, and metrics. Most reporting problems are actually data engineering problems in disguise. The dashboard is slow or wrong because the data feeding it is scattered across systems, inconsistent, or assembled by hand every morning. We fix the pipeline first, then the reporting sits on solid ground.
For many businesses, a well-structured reporting database alongside your operational systems is enough, and a full warehouse platform is overkill. A warehouse earns its keep when you have several source systems, meaningful data volume, and analytics that would slow down production if they ran against it directly. During scoping we look at your actual sources, volumes, and reporting needs and recommend the smallest thing that works: often Postgres with good modelling, sometimes BigQuery or Snowflake, occasionally a lakehouse.
Usually, yes. We have pulled data from systems via APIs, database replicas, scheduled exports, webhooks, and, where nothing else exists, screen-level integration. The approach depends on what the source system allows and how fresh the data needs to be. We assess each source during scoping and tell you honestly which are straightforward and which will need a workaround, so the integration effort is priced accurately rather than discovered later.
Every pipeline we build includes validation and reconciliation as first-class steps, not an afterthought. We profile the source data early to find the duplicates, the inconsistent formats, and the gaps, then build cleaning and deduplication into the pipeline with checks that flag when something looks wrong. For a one-off cleanup of historical data, we scope that as its own piece of work with a clear before-and-after.
A clean, well-modelled data layer is the prerequisite for reliable AI. Retrieval-augmented generation, agents that query your data, and any LLM feature grounded in your own records all depend on the data being consistent and accessible. When we build the pipeline, we design it so a vector store or a retrieval endpoint can sit on top without a nightly export job. Several teams come to us for data engineering specifically because their AI pilot stalled on messy data.
A focused project connecting two or three sources into a reporting database with a set of dashboards typically takes 8 to 14 weeks. A broader platform with many sources, a warehouse, transformation layers, and self-serve analytics runs 16 to 28 weeks. We deliver in phases, so the first useful dashboards land well before the whole platform is finished.
It depends on the number of source systems, how cooperative each one is, the data volume, and whether you need a full warehouse or a reporting database. We scope and fix-price it after seeing your sources. We do not quote a data project without understanding what we are actually integrating, because the source systems are where the cost lives.
You do, completely. Pipeline code, transformation logic, data models, dashboard definitions, and infrastructure configuration transfer to you. We build on standard tools and document the lineage, so your team or another vendor can maintain and extend it without us.
Yes. Most of our clients are in the United States, United Kingdom, and Australia, with agreed real-time overlap hours for each region. For UK and EU work we design pipelines with GDPR in mind, including where data is stored and how personal data is minimised in analytics.
The reporting infrastructure in COMPASS for Ball State University follows the model we use: source data collected under clinical research standards, transformed into a structure researchers can query and report against. i-mve consolidates job, quoting, invoicing, and accounting data across integrations into one operational view for 510 companies. We have built ETL between systems, reporting databases, and real-time dashboards across logistics, healthcare research, and property since 2017.
Platform-level reviews of the agency — not cherry-picked project comments.
What I love about Team7 is that they always say: No worries, we can find a solution. This is the mindset of builders, creators, people who do not have fear — the partner you need if you want to excel.
Working with Mo and his team over the past year has been nothing short of exceptional. I was admittedly sceptical about investing such a large amount — but results exceeded every expectation.
Team 7 is the best group of developers on Fiverr — and I promise it is not even close. The software they have developed has changed our company for the better.
30 minutes. No slides. We will look at your source systems and tell you honestly what a real data pipeline takes, and what it will cost.